Dramatic Change in Americans’ Drinking Patterns During Coronavirus Pandemic
BACtrack® data shows shift in patterns before and after shelter-in-place orders, and on average, an increase in drinking on weekdays and a decrease on weekends
We examined how drinking patterns have changed during the past month with the majority of Americans sheltering-in-place to slow the spread of the COVID-19 and the results were surprising.
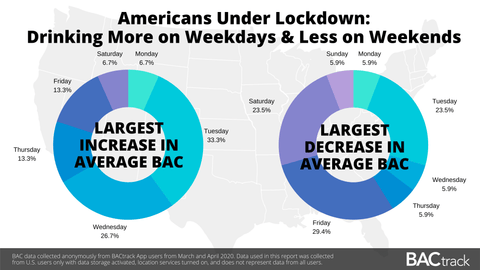
We analyzed anonymous BAC (Blood Alcohol Content) data collected in March and April 2020 and aggregated from BACtrack smartphone-connected breathalyzers and it revealed a dramatic shift in daily drinking patterns. On average, there’s a notable increase in drinking on weekdays and a decrease on weekends. BACtrack data also indicates drinking increases significantly just after shelter-in-place orders are issued.
Shifts in Weekday and Weekend Drinking
Average BAC levels have increased significantly on weekdays, especially on Tuesdays and Wednesdays, which are historically low drinking days. People are drinking at home more and perhaps due to anxiety, boredom, or not being required to wake up early and head out to work. At the same time, average BAC levels are decreasing on weekends, particularly on Fridays and Saturdays, with restaurants and bars closed. These drinking patterns are the complete opposite of typical drinking patterns and those identified previously through BACtrack’s alcohol consumption reports.
“We suspected people were drinking more on weekdays while sheltering in place and in analyzing our BAC data, confirmed this to be the case,” said Keith Nothacker, president and founder of BACtrack. “The most surprising finding is weekend drinking is actually decreasing in many areas,” Nothacker adds. “It’s the first and only time we’ve seen such a shift in Americans’ drinking patterns.”

BACtrack data also indicates there’s an overall increase in drinking in many regions. This finding is in line with other public reporting: surging alcohol delivery sales, the rise of video happy hours, and Nielsen data, which reports a 55% increase in U.S. sales of alcoholic beverages for the week ending March 21st.
Notable insights comparing pre- and post-shelter-in-place drinking patterns are detailed below. Results, including interactive data, can be viewed on our BACtrack-COVID-19 page and raw data can be found here.
- In the SF Bay Area, weekday average BACs are up 45%.
- In California, weekday average BACs are up 47% while weekend average BACs are down 51%.
- In Chicago, weekday average BACs are up 52% while weekend average BACs are down 26%.
- In Washington, weekday average BACs are up 72% while weekend average BACs are down 16%.
- In Arizona, weekday average BACs are up 63% while weekend average BACs are unchanged.
- In San Diego, weekday average BACs are up 57% while weekend average BACs are down 19%.
- In Texas, weekday average BACs are unchanged while weekend average BACs are down 21%.


Significant Increases in Drinking Post-Shelter-in-Place
BACtrack data also indicates a significant increase in drinking the very first day shelter-in-place orders are issued compared to the same day two weeks prior. It’s interesting to note drinking increases regardless of the day of the week.
Notable insights are detailed below and can be viewed on our BACtrack-COVID-19 page; raw data can be found here.
- In Washington, average BACs skyrocketed 426% the first day after the shelter-in-place order was issued and 79% the following day.
- In North Carolina, average BACs shot up 200% the first day after the shelter-in-place order was issued.
- In Arizona, average BACs increased 160% the first day after the shelter-in-place order was issued.
BACtrack Consumption Reports provide insight into Americans’ drinking habits.
Methodology
Data was collected anonymously from users of the BACtrack app, which syncs with BACtrack smartphone breathalyzers, and represents thousands of unique BAC tests collected from March 3, 2020, to date. Data used in the report was collected from users in the U.S. with location services turned on and does not represent data from all users.


